A1
Due Date: Oct 08 (23:55)
Visualization basics
The purpose of this assignment is to learn how to create visualizations using ready-made tools. One of the tools for this class will be the Tableau software package. Tableau automates the creation of visualizations and uses many of the proper visual encoding techniques that we will discuss during the course by default. A free alternative to Tableau is Lyra. You are welcome to use this instead, but we will not provide any support/help.
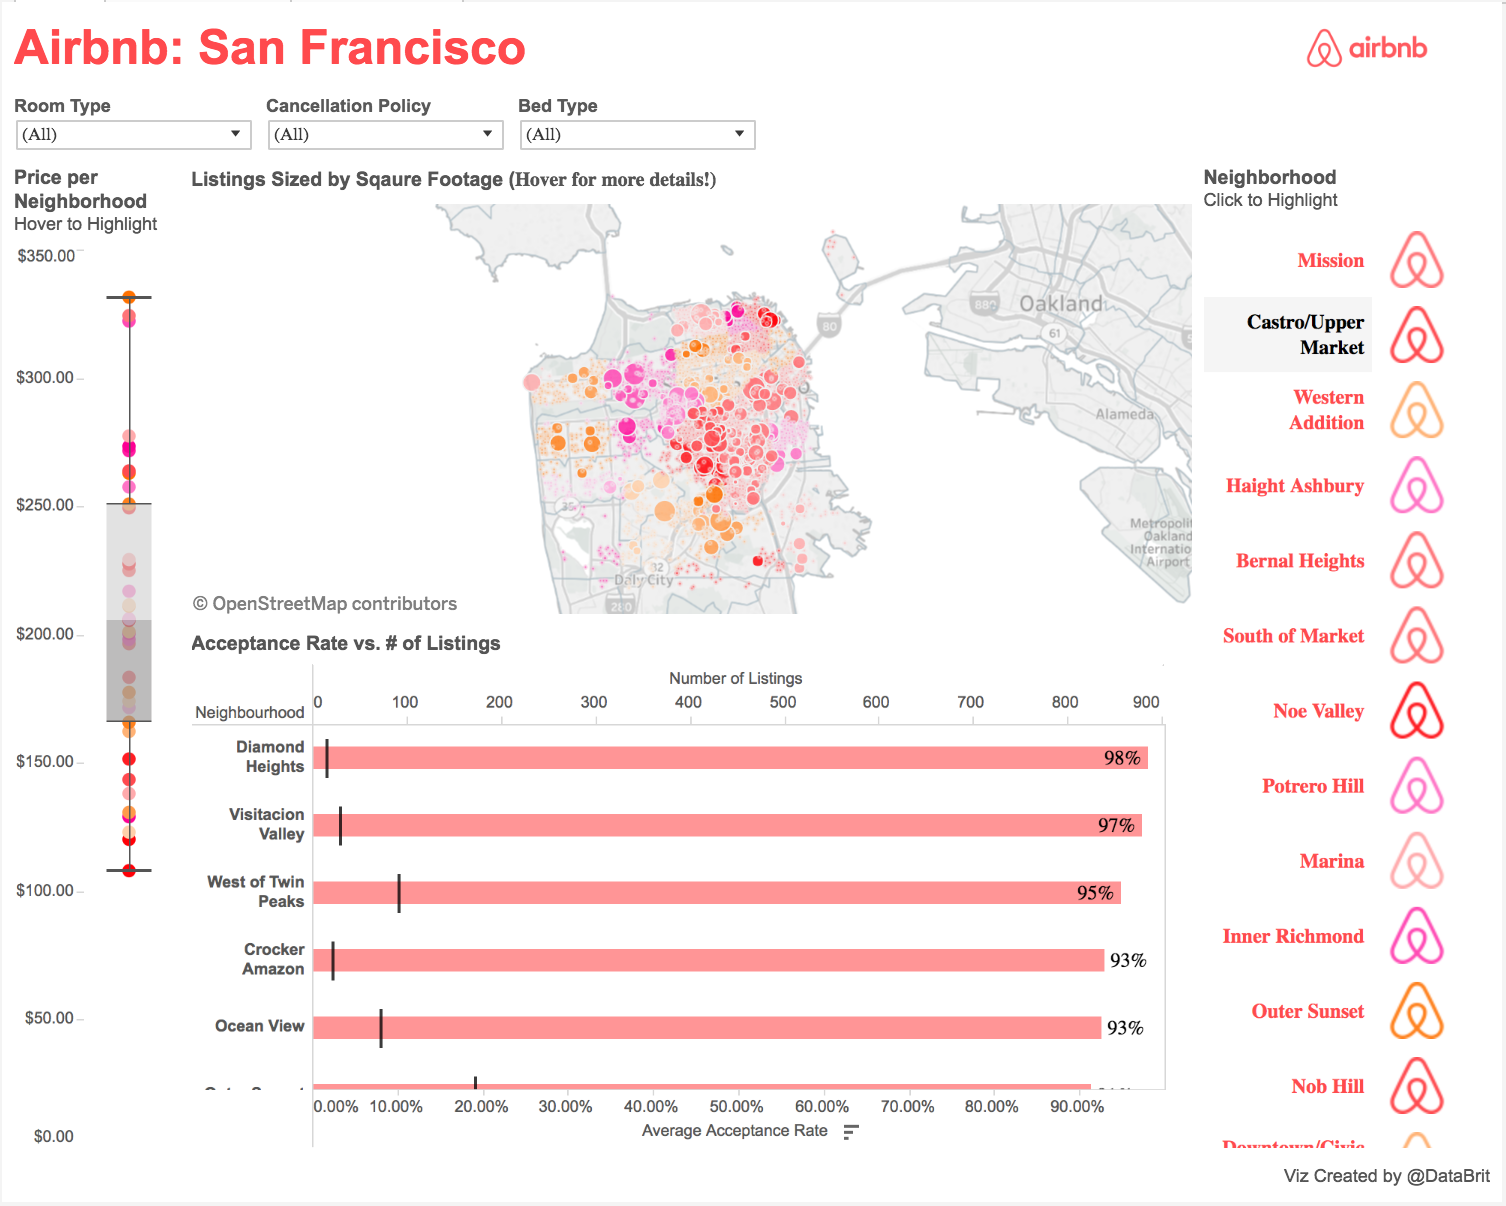
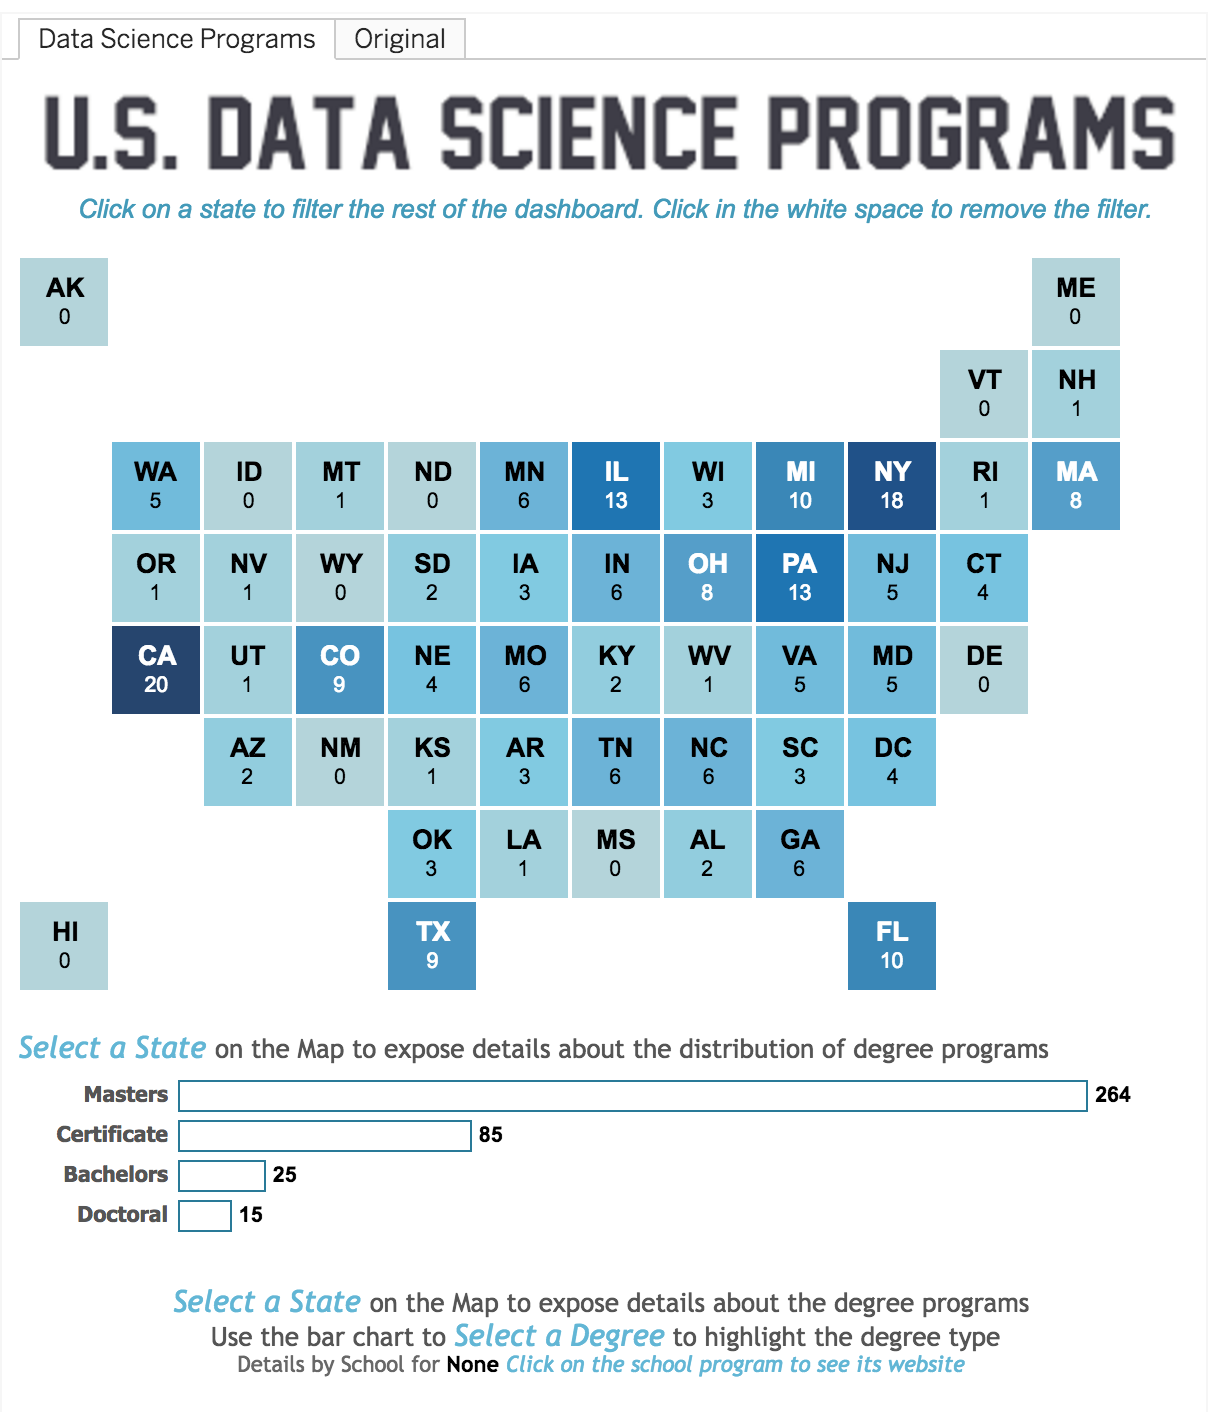
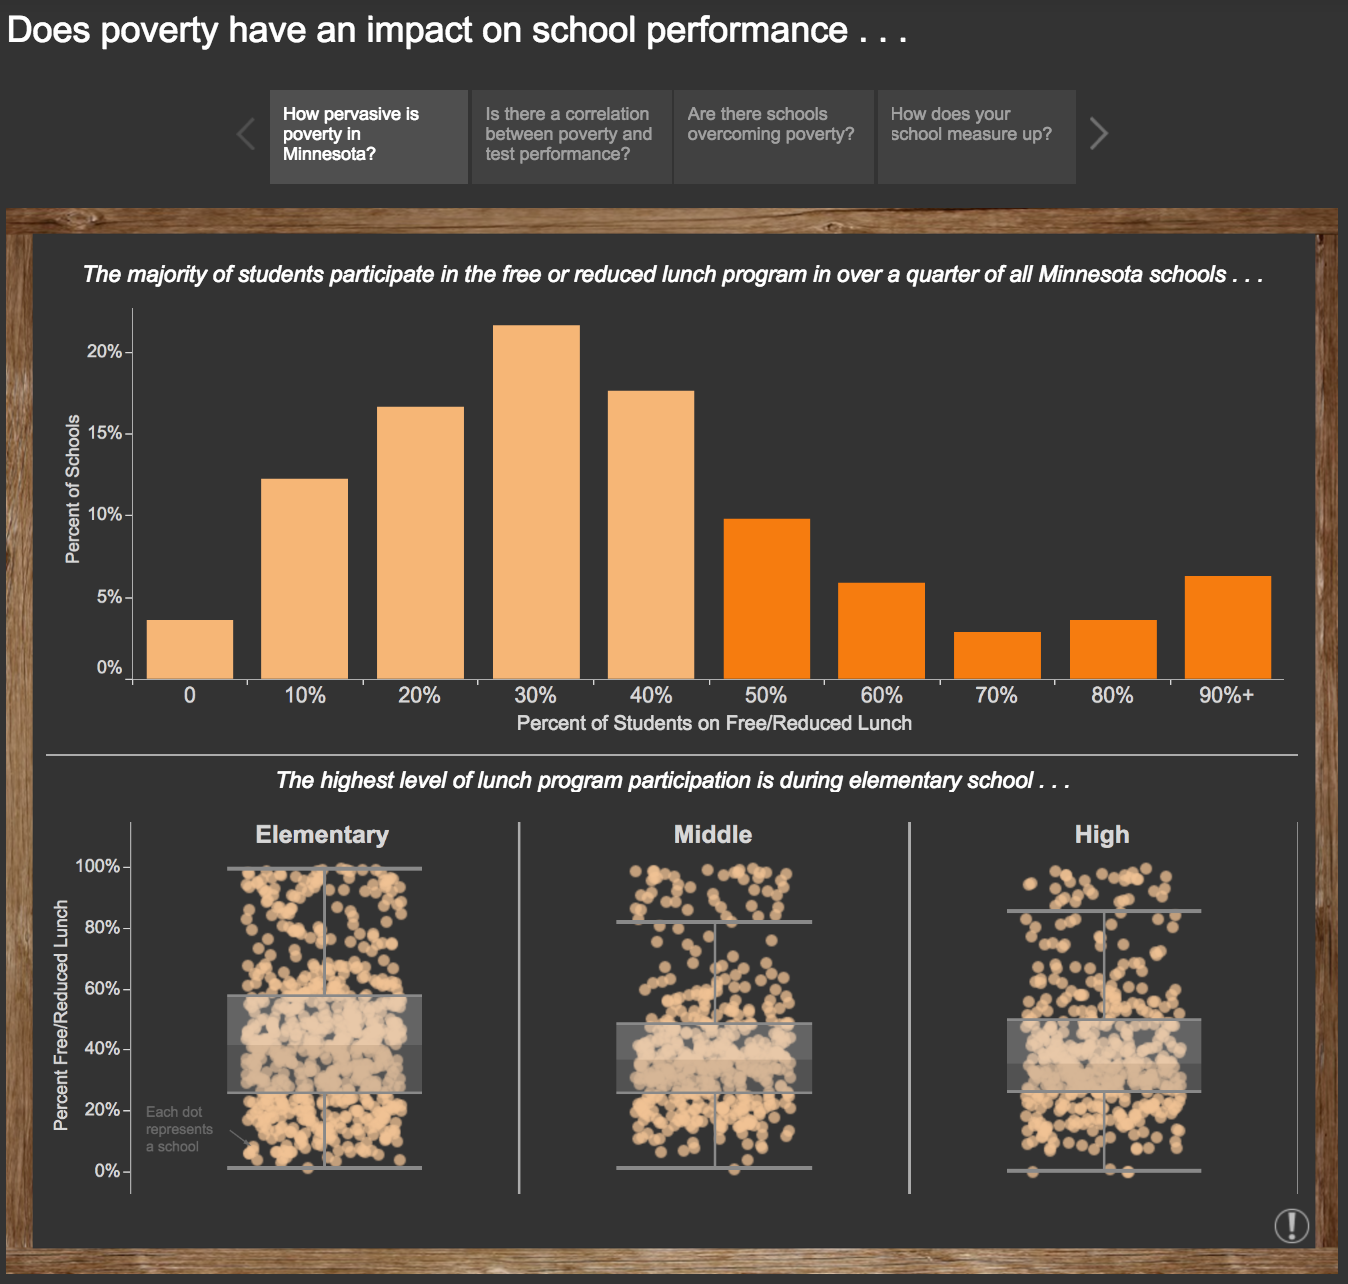
Here are a few examples from Tableau Public (Click on the image to open the Tableau Public site):
ToDos before October 5th (tutorial in class)
You will need to bring a laptop with Tableau installed on it in order to participate in the tutorial exercises during class. Therefore, please have Tableau installed on your machine before the tutorial on October 6.
1. Install Tableau
- Tableau for Students: http://www.tableausoftware.com/academic/students
- Drivers: http://www.tableausoftware.com/support/drivers
- Create a tableau public account: link
Tableau content that is published to Tableau Public on the web can be viewed in your web browser regardless of your operating system. However, to author and publish views and workbooks, you use Tableau Desktop Public and Professional Editions.
Tableau's data visualization software is provided through the Tableau for Teaching program.2. Please read
- Preparing Excel files for analysis
http://kb.tableausoftware.com/articles/knowledgebase/preparing-excel-files-analysis - If there are problems with Excel imports, export the Excel file as a csv file and import this file as a text file.
- Quick start guide: How to connect to data?
http://downloads.tableau.com/quickstart/main-guides/en-us/desktop_getstarted9.2.pdf - Dashboard design: https://public.tableau.com/s/blog/2013/10/dashboard-layout-and-design
- Tableau Tutorial: download PDF
- Tutorial Data: download CSV
- Tutorial Dashboard:
3. Connect to data
To make sure you are all set for the tutorial try to connect to an excel sheet (e.g. the assignment dataset, see link below).
It works? -> Perfect
It didn’t? -> Try to fix it – maybe a driver is missing (see link above) or convert excel to csv
There is also a Moodle Forum if you want to share insights with your fellow students or if you encounter problems.Homework (due October 08)
The first part of your assignment is to develop a single interactive Tableau dashboard with several views, that would allow manipulation and exploration of the City of Urbana arrests dataset in various ways. A view is a single graphical representation of the data (i.e. a chart) and a dashboard connects multiple views in a meaningful way. Any dashboards after the first will not be counted towards your grade.
To make the experience of navigating through data more effective, you will need to use techniques previously learned during the tutorial session (e.g. drill-down, cross-filtering). Your solution should also provide a coherent overview of your personal findings. Here are some tips to help you with your data analysis. Look for logical connections between several data fields and possible patterns within each. Think of the questions that may be answered, for example: Over the years, how did different crime types develop; what is the avg/min/max age in those different types, how does type and year of arrest correlate or which months are the savest ones.
The second part of your assignment includes a short write-up (2-3 pages) that describes the reasoning process that led to your final visualizations. This write-up should discuss alternative ideas you had, insights you gained from the data, and why you went with your final design choices. Try to incorporate the things you learned from the design principles class. This write-up will be a major part of the grade for this assignment so try to clearly explain your ideas. Please also include screenshots or sketches where necessary to make your point. You can also include a short reflection on your experiences with Tableau itself. For example, any difficulties you had with making exactly the view you wanted or the ease of prototyping.
Dataset: City of Urbana arrests since 1988
This is a big dataset including sensitive information like age or race.
Data: Official website or from our server as a csv file.
Submission
You will have to sign up for a free Tableau Public account and when you are finished with your dashboard in Tableau Desktop, publish it to the web by following: Server -> Tableau Public -> Save to Tableau Public...
Please also submit your assignment as a zip file containing both your Tableau dashboard and a short write-up essay (as pdf) to Moodle. For this, you will have to save your visualization as a "Packaged Workbook" (File -> Export Packaged Workbook). This will save the data with the workbook so that both visualizations and data are packed up in one file. Failure to do this will result in a 10-point penalty. The write-up should include a link to your Tableau Public dashboard. There is a share Button for each dashboard, use this link. Please note: If you only submit to one of two place (Tableau public or Moodle) the assingment will not be counted as submitted!
The report (including the link to the Tableau Public Dashboard) and worksheet should be uploaded to Moodle by 23:55 on October 8th. Use the following naming scheme for your submission: "matrikelnumber_A1.zip". Late Submissions are possible, yet they will be penalized.
Grading
We will evaluate your Tableau visualization based on the quality of communicating the fundamental aspects of the given dataset. Does it give the viewer a good understanding of the different characteristics of the data and exploratory insights? Here, we are looking for both effectiveness and creativity. We do realize that people have differing levels of design ability and experience. Therefore, we are also looking for a good effort, not necessarily some conference paper-worthy new idea. The purpose of this assignment is to provide you with experience in the analysis of data like this and the design of visualizations to present the data.
We will grade your submission and presentation with the following scheme:
- 15 % producing an interesting solution / creativity
- 25 % proper use of visual encodings / interactions
- 10 % implementation / realization
- 50 % explanations / reasoning why this is a good visualization
The report and worksheet should be uploaded to Moodle by 23:55 on October 8th.
Late submission
Late Submissions are possible, you have a total of two grace days for all three assignments (A1, A2, and A3). After these days are used up, remaining assignments must be submitted on time.
Academic Honesty