A3
Due Date: Oct 30 (23:55)
Project criminal travel analysis
Goal
For this assignment let's build a dashboard that will help to figure out the correlation between people's travel and the crimes they commit. We want to answer questions such as do people from out of town commit certain types of crimes or do people from different towns commit certain crimes? To answer these we'll build a dashboard-style system consisting of a spatial map view along with some basic plots. These will all be linked interactively using brushing and linking. For this assignment we'll be using the same dataset as in A1.
Tasks
For this project first think about the tasks you want to accomplish. Here are some but you will probably come up with more:
- Find the distribution of crimes committed in Urbana for each of the surrounding cities
- Are there certain times when more people come to Urbana?
- What types of crimes do people from each city commit?
Procedure
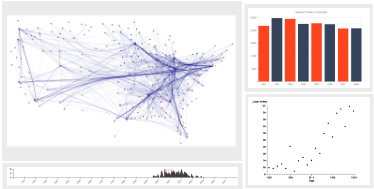
Your final dash board should consist of four panes like the example image: a map view with bundled edges showing where the criminals are from and where they're going to (Urbana), a timeline view showing the distribution of crimes over time, a histogram chart to show distributions of one parameter, and a scatterplot view to show distributions of two parameters.
You may develop your dashboard however you want but we have provided an order to the features below to help guide you.
- Ensure that you can load the data properly into d3
- Make the map view of the area surrounding Urbana, IL with edges showing where the people come from to commit crimes
- Implement the timeline histogram view
- Implement the bar graph histogram showing the overall distribution of crimes
- Implement the scatterplot showing the distribution of when the crime occured (x-axis) and the distance to Urbana (y-axis)
- Add a tooltip when highlighting cities on the map showing a histogram of the types of crimes from that city.
- Time for interaction! :) Set up a year filter so that if you click in the timeline view it will filter the year. Ideally you should be able to scrub in the year histogram and have the filter update
- Add a brush filter to the scatterplot and bar graph to only show edges corresponding to the selected points/bars.
Since the focus is on learning how to make interactions with d3, you may use the edge bundling and tooltip libraries that comes with d3 but you must ask us beforehand if you want to use any other libraries.
Submission instructions
Please submit a folder containing an index.html file which will open the
dashboard view, the data file, and a readme describing what you did, why, and
the data source(s)
you used, as well as any other associated files to moodle. Please be sure if you
submit a zip or tar.gz file that it properly unzips the files into a directory.
It's a good idea to try unzipping your file before submitting it to ensure
that everything unzips properly and you don't lose points. Use the following naming scheme for your submission: "matrikelnumber_A3.zip".
When we grade your work we will run
python -m SimpleHTTPServer
Just to be clear, here is a sample directory layout. You do not have to use this exact format but it must be clear which file is your readme, your html page, your data file, and your javascript file.
a12345678
  \
  | README.md
  | index.html
  | d3.min.js
  | vis.js
  | style.css
  | data.csv
Grading
Rather than grade the assignment based on what features you need to implement and give you a numerical grade based on that, I'm going to define what we want you to learn from the assignment. It's a bit of an experiment but I think it will help to explain why we're asking you to do certain things.
I've broken the learning objectives down by numerical grade, 1 through 5. You will receive the best grade for which you've met all the learning objectives plus all below. Please be aware that that means that if you haven't met some objective for gettting a 3 then you'll get a 4 even if you've completed all the objectives for grade 2. We've structured the objectives so that they build on each other for the most part. So, in order to show that you've learned something for grade 3 then you'll need to show that you've also met all requirements for grade 4 and then some.
Grade 4
- submitting according to the procedure
- properly setting up an html page with d3, css, etc included
- loading data into d3 from csv
- properly laying out the svg elements in html
Grade 3
all the above plus:
- for each task describing concisely (1-2 sentences max) how your implementation addresses those tasks
- creating svg shapes (boxes, lines, circles) based on data
- showing axes for the histogram, timeline, and scatterplot
Grade 2
all the above plus:
- explaining interesting information to be gained by your visualization
- data filtering based on mouse interaction
- axis scaling based on filters
Grade 1
all the above plus:
- Changing the visual encoding to match the data type, for example, changing the scatterplot to a heatmap if one of the axes is categorical
- mouse scrubbing interaction
- Interface to change what is displayed as the x/y axes in the scatterplot and histogram
- Creating animated transitions
Late submission
Late Submissions are possible, yet they will be penalized.- 0 - 24 hours late: 15% penalty
- 24 - 48 hours late: 30% penalty
- 48 - 72 hours late: 50% penalty
- 72 hours or more late: 100% penalty
Resources
A selection of helpful JS/d3/mockup tools that may be helpful
Javascript/d3 tutorials
- JavaScript-Tutorial for programmers
- D3 Official Tutorials
- Dashing D3.js
- Chad Stolper's tutorial slides
- discover dev tools (chrome dev tools interactive course)
JS programming tools
- npm - package manager
- bower - package manager
- gulp - build tool
- grunt - build tool
- browserify - npm modules in the browser
- RequireJS - module loader in the browser
Mockup tools
- Balsamiq (http://balsamiq.com)
- Mockflow (http://www.mockflow.com)
- appery.io (http://appery.io)
- Axure (http://www.axure.com/ -- free for students)
- for a more complete list see the HCI resources